
CREATOR MEDIA KIT · OCTOBER 2026
Local influence.
Broad discovery.
I’m Giselle Lelux. I turn dining, travel, and lifestyle experiences into stories people want to save and share.
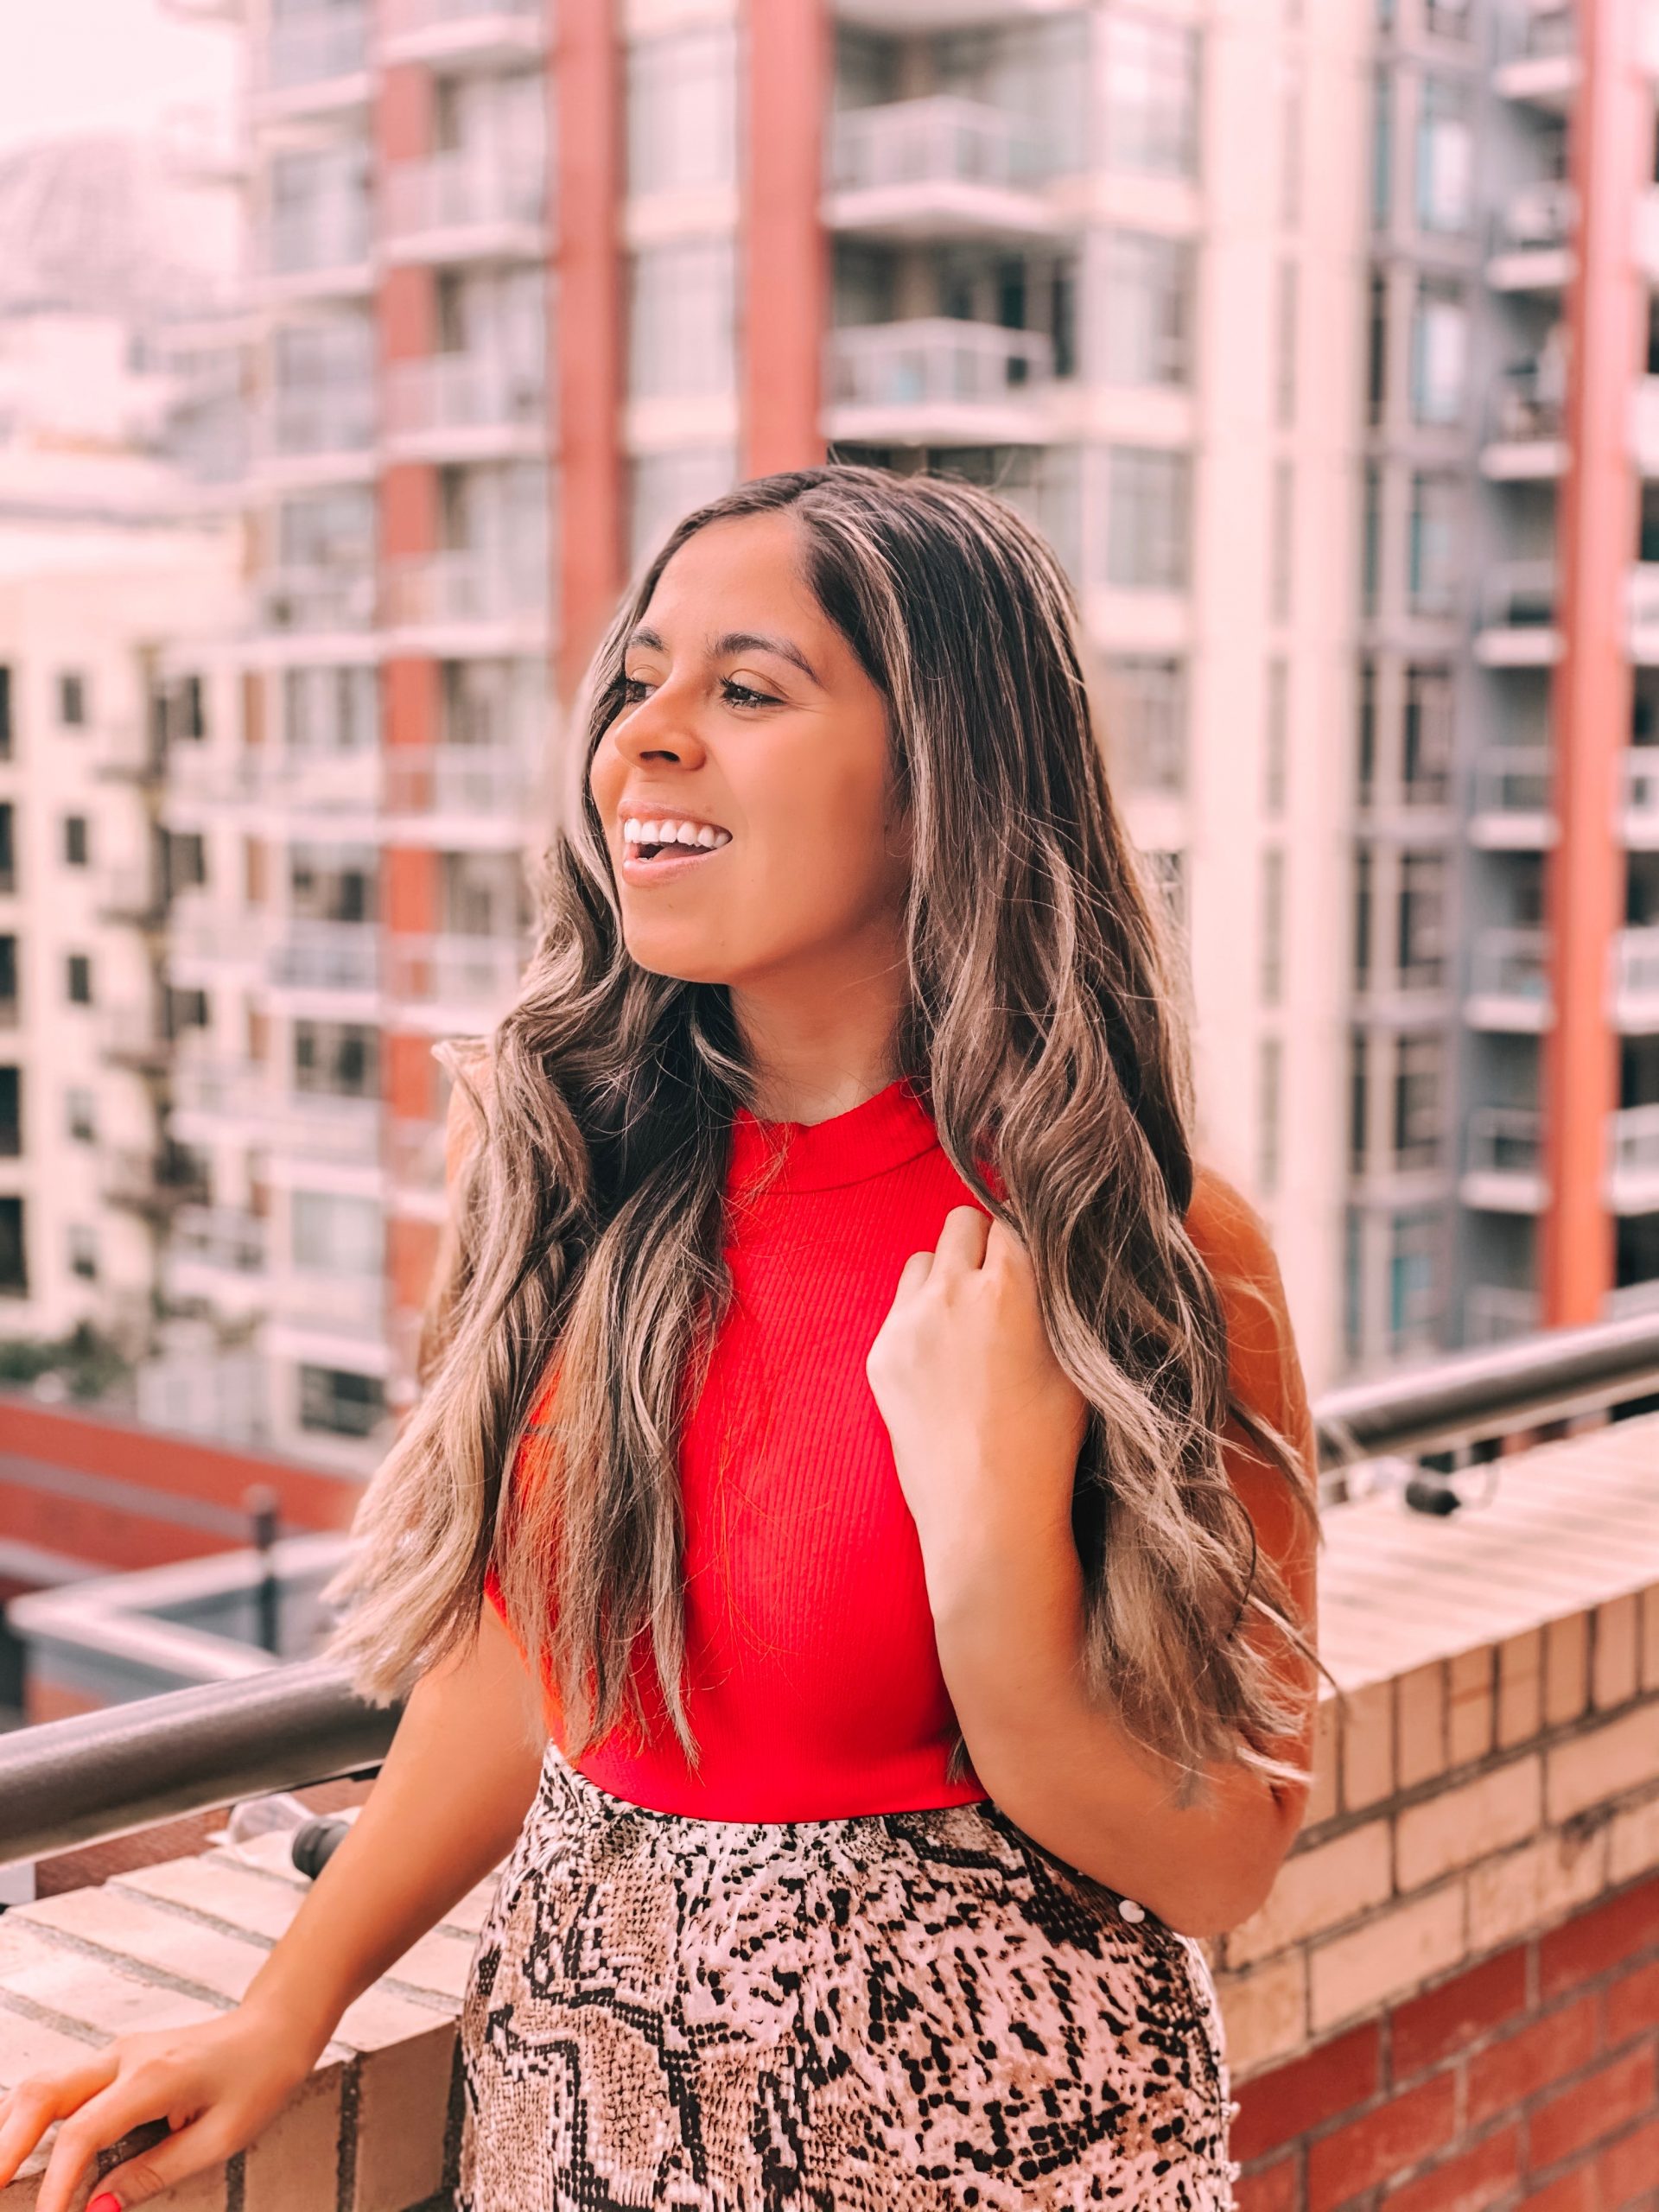
A community that keeps discovering.
157K+
Combined followers
& subscribers
5.8M+
Estimated average monthly
content views
Instagram · Facebook · TikTok · Threads · YouTube
Followers and subscribers are combined across five platforms. Monthly views are estimated from three platforms in the October media kit. Audiences may overlap.
Sources & reporting notes
Combined community: 98,636 Instagram followers (Insights checked October 22, 2026), 39,175 Facebook followers (October media kit), 7,976 TikTok followers, 9,497 Threads followers, and approximately 2,250 YouTube subscribers (profiles checked October 22, 2026). Total approximately 157,534. Platform audiences may overlap; this is a sum of follows and subscriptions, not unique people.
Estimated combined views per 30-day month from the October 2026 media kit: Instagram 1.9M Reel views over 30 days + TikTok 1.5M post views ÷ 60 × 30 + Facebook 2,988,672 views ÷ 28 × 30 = approximately 5.85M. Displayed conservatively as 5.8M+. Reporting windows end October 15 and start on different dates. This is a normalized historical estimate of content views, not unique reach; repeat views and audience overlap are included. YouTube and Threads views are excluded because the media kit does not report them.
Instagram, at a glance
98K+
Instagram followers
2.5M+
Estimated average Reel views per month
93.5%
Of views from non-followers
Sources & reporting notes
Instagram Insights checked October 22, 2026: 98,636 followers and 7,663,284 views over 90 days; 97.9% from Reels. Estimated average Reel views per 30-day month: 7,663,284 × 97.9% ÷ 3 = approximately 2.50M. This newer Instagram snapshot is separate from the October media-kit reporting periods used in the combined views estimate.
Rooted in San Diego
71.1% women · 69.4% ages 25–44 · 31.2% San Diego
Other leading Instagram audience cities include Tijuana and Chula Vista. San Diego also accounts for 55.6% of my Facebook audience.
TikTok
1.5M post views in 60 days.
106.8K likes · 31.1K shares.
2.98M+ views in 28 days.
39K+ followers · 96.8% non-follower views.
The numbers, clearly.
Sources & reporting notes
October 2026 media kit: Instagram September 15–October 15 (30 days); TikTok August 17–October 15 (60 days); Facebook September 18–October 15 (28 days). Instagram demographics are from that 30-day report; Facebook audience breakdowns are lifetime. The combined estimate normalizes reported views to 30 days. Views are not unique reach and are not a campaign guarantee. Instagram ages 25–44 combine the 25–34 and 35–44 groups.
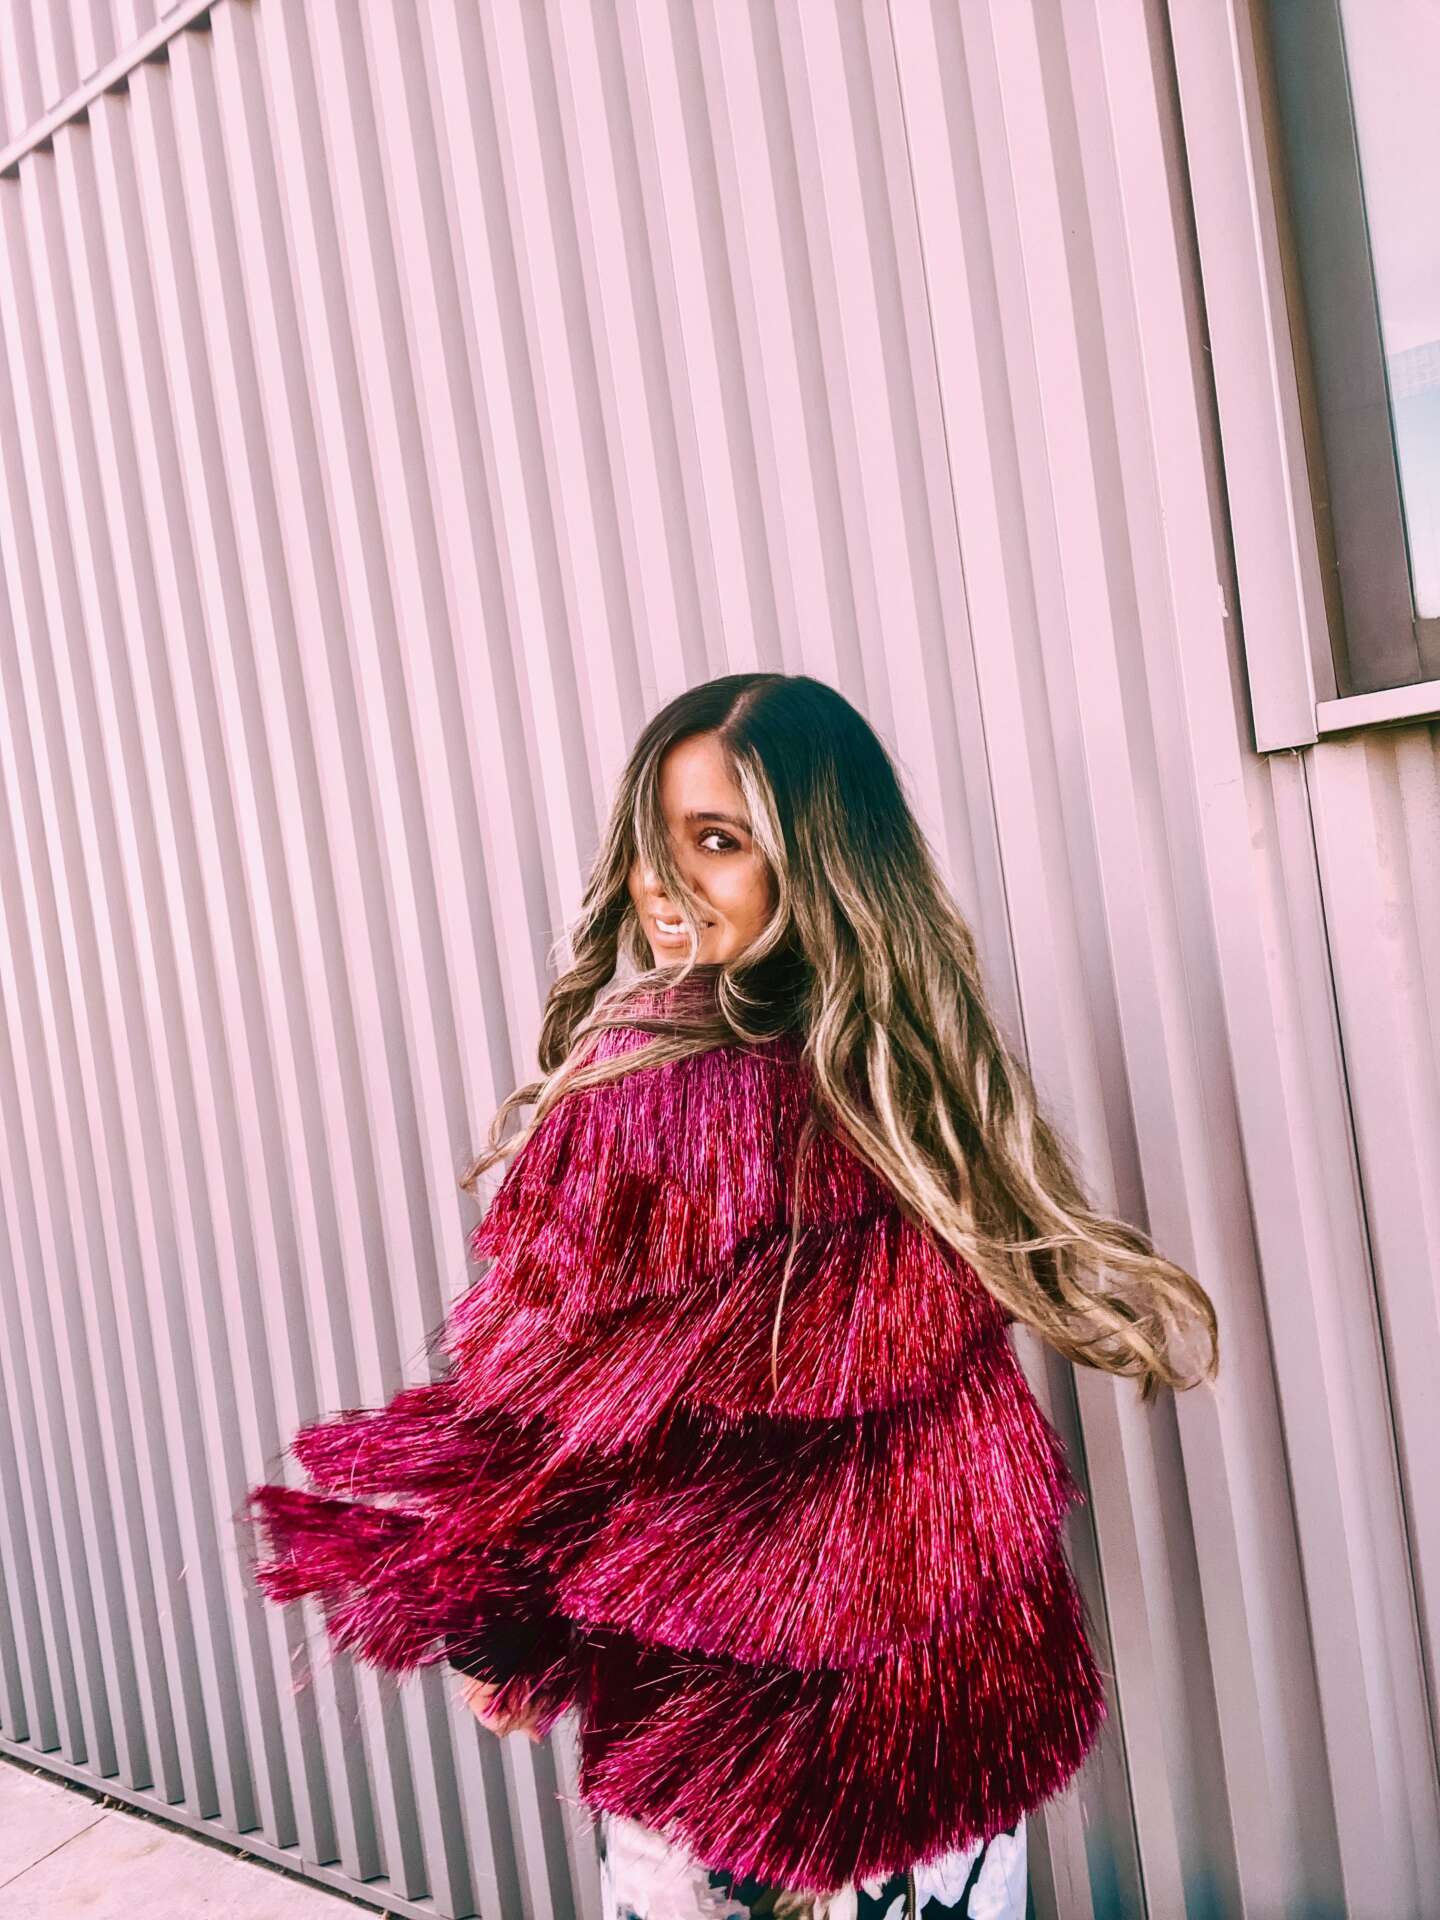
Stories we can create together.
Restaurant and hotel experiences. Destination storytelling. Local events and attractions. Lifestyle and fashion. On-location photography and short-form video.
I bring experience with local and national brands, creative concepts, and an eye for the details that make a place worth discovering.
A glimpse of my work
Places people want to experience. Stories they want to share. Explore a few of my recent high-performing Reels.
Werewolf brunch
415K+ views
321K+ accounts reached
Seasonal dining with a playful point of view.
Fiesta de Reyes
425K+ views
335K+ accounts reached
Color, culture, and local discovery in Old Town.
Baby Grand, Coronado
325K+ views
239K+ accounts reached
A visual escape inside a San Diego hotel.
Instagram Insights checked October 22, 2026. Figures are rounded down; views and reach are different measures. Insights may include paid distribution. These creative examples do not imply every venue was a paid partner. Seasonal details reflect the original posts.
THE INFLUENCER’S HANDBOOK
Creator. And author.
My guide to personal branding, creating content, and building thoughtful brand collaborations. Bring your own creator vision to life with The Influencer’s Handbook.

